Tree of Branch
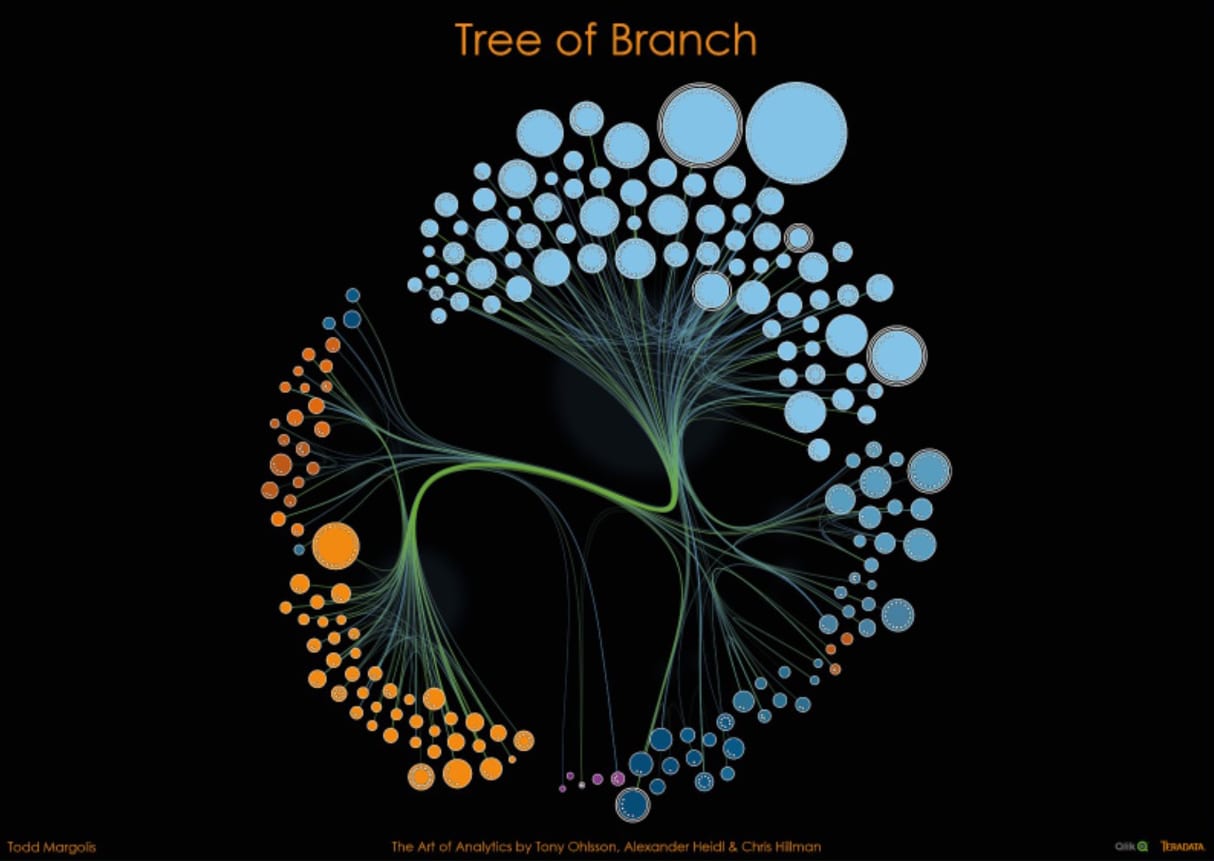
This visualization, featured in Teradata's Art of Analytics book, was generated to assist with the exploration and analysis of Qlik's open-source developer community, Branch. Originally intended as an interactive, open-ended discovery and navigational platform, the application enables visitors to uncover new meaning within the complex web of users, projects, and relationships. By representing metadata such as project similarities, view counts, and corporate affiliations, the work facilitates a deep understanding of the social dynamics and individual behaviors that drive the ecosystem.
The visual architecture uses nodes to represent individual projects, scaled by view counts to immediately surface high-impact contributions. To visually quantify collaboration, each node encodes the number of contributors and comments, with clusters colored by product category. This multi-layered system—which earned its place in the Art of Analytics publication for its blend of technical rigor and expressive form—utilizes links to trace the intricate relationships between projects based on shared similarities and overlapping user bases.
The visualization reveals a strong community focus on visualization extensions, dominated by two primary clusters, while identifying several emerging clusters that indicate opportunities for growth. Light blue links use edge bundling to demonstrate high similarity both within and between Qlik's primary visualization categories. Perhaps most notably, the light green links show that most contributors develop projects across the entire product spectrum, proving the versatility of the underlying platform and the cross-disciplinary nature of the developer community.
About Todd
My research represents a formal inquiry into the friction between users and data. By architecting novel hardware and algorithms, these projects establish new benchmarks for how we visualize and interact with massive, multi-dimensional datasets.
Learn More